Overview
Recently, I’ve shifted from primarily performing red team engagements to assisting in the development of Chariot, Praetorian’s attack surface management (ASM) and continuous automated red teaming (CART) product offering. Our Praetorian Labs team has developed multiple tools to support Chariot and our Services organization. One of these, a subsystem for the core asset enumeration and scanning pipeline within Chariot, performs automated identification of externally facing assets with rapid and continuous checking for high risk and critical risk issues. Other tools include Fingerprintx , which rapidly fingerprints open ports to identify externally facing network services and collect detailed metadata, and Nosey Parker , which sniffs out hardcoded secrets.
As with most complex software engineering projects, each of these tools involved multiple developers pushing new code daily or hourly. When working this way sometimes a change can inadvertently introduce a bug into the system. Sometimes, these bugs can only be triggered through complex edge-cases and thus won’t be caught by our standard integration tests or unit tests. This is a real problem from a developer perspective, because our Security Engineers, both on our Chariot team and in our Services organization, use these daily. They rely on us to minimize and mitigate bugs as efficiently as possible.
To address this problem we developed a custom end-to-end testing solution named Inspector that addresses many of the issues we had with our previous testing model. This article discusses our approach to building a continuous end-to-end testing solution to improve the reliability of our scanning pipeline.
What problem does the Inspector tool solve?
Before developing Inspector, we primarily leveraged integration and unit tests to perform testing of individual components. However, this approach had several problems that caused issues when deploying changes to our scanning microservices in production.
Using containers, we can easily replicate our application’s software environment between various deployment environments (e.g., a developer laptop, staging, and production). Unfortunately, within a sufficiently large distributed system, factors exist that cause the overall system to malfunction but which aren’t directly related to the service itself. Instead, the relationship between components, dependencies on third-party services, or the nature of the workloads running within different environments create the bug. Inspector aims to mitigate these complicating factors.
Acknowledge that Production Workloads Differ from Testing Workloads
Imagine, for example, a rate limiting bug where a service that performs subdomain enumeration may become rate limited by an upstream service it queries to passively discover subdomains (e.g. vpn.praetorian.com) for a given top-level domain (e.g. praetorian.com). This bug arises from a rate limiting issue that may only be reproducible under a large-scale production workload. Let’s assume that in this case, the tool managing subdomain enumeration failed silently. Unfortunately, this bug wouldn’t be discoverable under a testing environment (or when running the service from a developer’s laptop), because the workload is not comparable to the production workload. We do attempt to replicate production workloads in our UAT environment by scanning many public bug bounty programs; however, we still encounter occasional edge cases that we can only reproduce in production.
We also have observed other classes of issues in this category. For example, a service may crash due to a memory leak issue under production workloads, but pass testing within a staging or UAT environment where the workload isn’t as high. Yet another example is a scenario where we were running multiple port scanner pods on the same worker node within our Kubernetes cluster. Our port scanner scans all 65535 potential TCP ports, so running multiple instances of the port scanner on the same node can sometimes cause network performance issues across the node. Testing in a staging or UAT environment would not uncover this issue, because the workload wouldn’t be sufficiently intensive.
Inspector’s Solution
Inspector solves this problem by performing continuous end-to-end testing of the entire scanning pipeline across all environments including our production environments. Testing in production allows us to identify issues that may only be present under a production workload; it’s never possible to fully replicate production even in well-maintained testing environments.
Notice When Upstream Modifications Impact Downstream Services
Another scenario for bug introduction occurs when a developer modifies an upstream service upon which several downstream services rely to produce events in a different format or leveraging a different event schema. Anytime a developer modifies the format of an event produced by an upstream service they must then update the downstream services to accept the new event schema and process those events properly. However, sometimes a developer may forget, or not know, they need to modify a given service to leverage the new event format.
Inspector’s Solution
We use multiple methods, including end-to-end testing, to detect these errors. For example, Inspector writes all events that fail schema validation to a dead letter queue with information on the event and the source service. We can monitor this queue to identify services that haven’t been properly updated to function when the event schema or format changes.
The schema validation processor also logs an error when an event has an invalid schema. By monitoring a combination of the number of rejected schema events (this should be zero almost all of the time) and the number of errors the service produces, we can diagnose the problem quickly. In this case, leveraging end to end testing with other monitoring enables us to hone in on potential problems.
Detect Unpredictable Developer Mistakes or Errors
Another common scenario involves a developer introducing a bug to the production environment because they accidentally didn’t test their changes before deploying them to production. In a recent case, the developer made a mistake when updating the container image deployed to our staging and UAT environments by copying the wrong image hash. The hash they used corresponded to an older version of the application that existed before they made their changes.
Unfortunately, this meant their testing was worthless as they weren’t testing their code modifications at all. In this scenario, the developer made a change which introduced a subtle bug in a critical internal service used for the orchestration and routing of events. This bug wouldn’t have been caught by our unit tests or integration tests since it only was triggered through a sequence of related events sent between services that wouldn’t be possible to meaningfully replicate with an integration test.
Inspector’s Solution
Fortunately, Inspector was able to detect that the service wasn’t functioning properly in production. This was possible since we designed Inspector’s test environment to incorporate a variety of edge cases we have encountered when scanning real world customer environments. By continuously performing testing of our three primary environments we can uncover issues that might only be discoverable in our production environment.
Identify Non-Deterministic Bugs Using Continuous Testing
The sheer volume of data generated by Inspector’s continuous end-to-end testing has allowed us to identify some bugs that only occurred non-deterministically. We execute end-to-end testing of the entire system every two hours, which comes out to roughly twelve end-to-end tests per day and eighty-four end-to-end tests weekly.
For example, we recently identified a bug that only triggered once every five or so executions of our end-to-end testing suite. Tools for subdomain enumeration, such as amass, subfinder, and assetfinder, often have a substantial amount of overlap in terms of the third-party services they invoke to gather information. Most scenarios usually run a single subdomain enumeration pod on a particular node in the cluster at any given time. However, we identified a rare edge case where AutoPilot scheduled three or more subdomain enumeration tools to execute on the same node.
A single node was running multiple pods, all performing subdomain enumeration against similar services, which unintentionally triggered some rate-limiting issues. Fortunately, by using podAntiAffinity to prevent more than one subdomain enumeration tool from running on a single node we can prevent most of the issues we observed with rate limiting. Figure 1 shows the YAML we added to each deployment to prevent subdomain enumeration pods, regardless of the underlying service/tool (e.g., amass or subfinder), from being colocated on the same node .
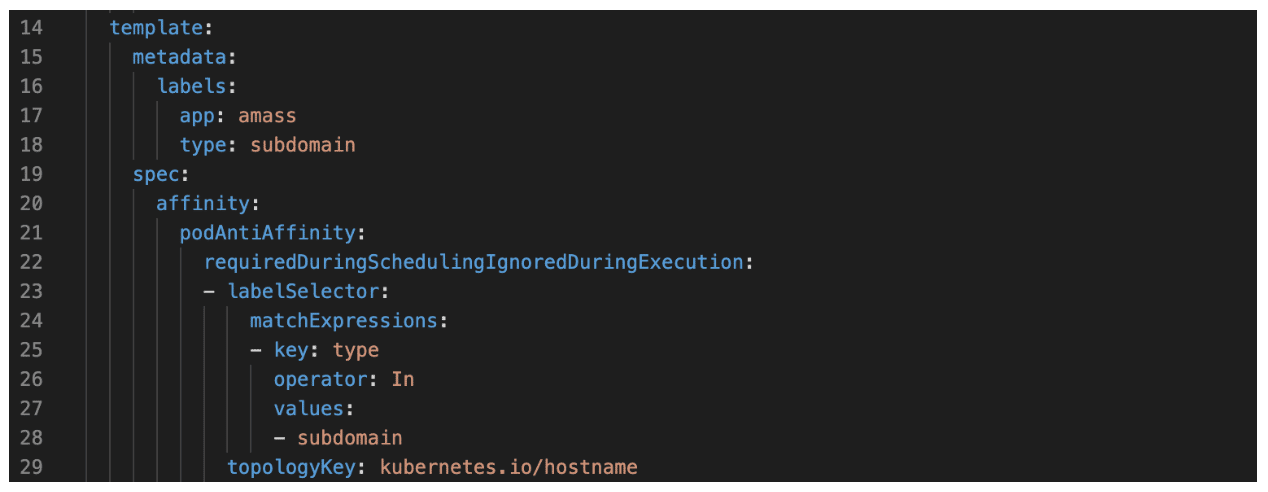
Figure 1: A podAntiAffinity policy we added to the deployment of our Amass scanner to ensure that the Amass scanner pod isn’t colocated on the same node as other pods that also perform passive subdomain enumeration.
How does Inspector work?
Modes
Inspector supports two modes of operation. The first mode of operation is standalone mode wherein users interact with Inspector through a command line interface. The other mode, which we refer to as Kafka or daemon mode, occurs when we invoke Inspector as a container within our production Kubernetes cluster. We accomplish this by deploying a CronJob which invokes the Inspector container every two hours and passes an environment variable to the Inspector utility indicating it should run in daemon mode.
Regardless of mode, Inspector begins by taking a snapshot of the state of the scanning pipeline and examining changes to the pipeline state over time to verify that the expected scanning activity and events were performed with the expected result.
Standalone Mode: the Nuts and Bolts
To implement end-to-end tests Inspector uses a plugin-based architecture where developers adding new services or topics can write a plugin that registers a callback to inspect events in a given topic. This allows the tool to verify that the pipeline created appropriate events and that everything is functioning properly. Sometimes we need to perform complex correlation work within the scanning infrastructure so continual testing of edge cases is important. It allows us to ensure that a small code change doesn’t introduce a subtle, but serious bug into the scanning infrastructure.
Daemon Mode: the Nuts and Bolts
Daemon mode is quite interesting as we leverage two topics, one called caseInspectorState and the other called caseInspectorMetrics. We use the state topic to track the state of the Inspector between executions and to determine the state of the previous scan. Two hours later, the Inspector container is invoked again.
The testing container observes that a previous scan has been executed so it creates a secondary snapshot of the pipeline, gathers events related to the end-to-end test invocation by inspecting event headers, and then invokes the appropriate plugins to perform checks against the respective topics and service. After it performs the tests it writes the results to the metrics topic. Finally, it kicks off another end-to-end test of the system, creates another snapshot, and stores it in the state topic.
A secondary Inspector metrics service ingests these metrics events from the metrics topic and exposes a metrics endpoint that Prometheus leverages to ingest the results of the end-to-end tests. We then ingest this data through Prometheus into a centralized monitoring dashboard which we leverage to monitor the state of our staging, UAT, and production environments.
Why We Love Daemon Mode
The Daemon Mode approach offers numerous benefits, as the Inspector service can be entirely stateless with its previous state stored in Kafka. Additionally, we can easily inspect the topic manually to identify the previous states of the Inspector utility and the results of previous end-to-end tests over time. Figure 2 shows a diagram of how Daemon Mode works within Inspector and in conjunction with tools like Prometheus and Grafana.
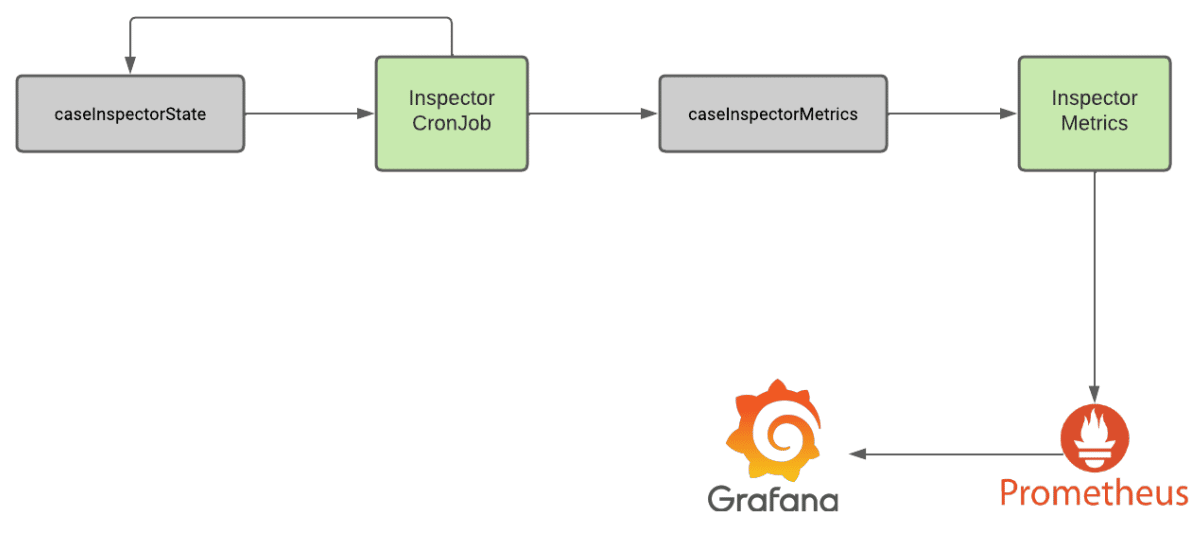
Figure 2: A diagram outlining the architecture of the Inspector tool when running in our production environment
Conclusion
I’ve very much enjoyed the time I’ve been spending working on Chariot. While I’ll always be a Red Teamer and security researcher at heart, learning more about designing event driven microservices architectures has been interesting. I’ve also enjoyed learning about various technologies we leverage in Chariot such as Redis, Kafka, Kubernetes, and Rego (for our internal policy-as-code engine).
Inspector has saved our team countless hours of debugging and given us more confidence in the reliability of our scanning infrastructure. Over time we’ve developed a lot of custom tooling, dashboards, and scripts that have allowed us to operationalize, scale, and monitor our scanning infrastructure. In the future, we plan on releasing some additional blog posts or open source tools related to these capabilities as they become more mature and fully operationalized within our production environment. While some of these tools are very specific to our use-case, others are more generalized in nature and we believe that sharing information on our solutions to these problems could help others running into similar problems as they develop event-driven microservices applications.