As Phil Venables has said, “at some level, cyber defense is a battle over whether the attacker or defender has better visibility of the target. Action is key, yes, but without good ‘cyber cartography’ it can be hard to act in the right way.” An attacker’s first step is enumeration, or identifying what looks hackable. Defenders work similarly–identify what looks hackable, and ensure it is not. For both efforts, understanding the full scope of a target is essential. The phrase “mapping a target” is a succinct way to communicate this task, but the idea of seeing and understanding an attack surface is more beautifully called “cyber cartography.”
In this post, we will summarize the core steps of security analysis, explore mapping and interpretation support in existing open-source tools, and discuss strategies for enhancing such tools. We also will announce a new feature in Chariot that red and blue teams can use to navigate the map of a target’s infrastructure.
Security Analysis and Mapping
The process of building a geographic map involves three general phases. First, the cartographer builds the list of continents, countries, and cities they need to include on the map. We could call this enumeration. Then they place the locations in the correct spots on their new map. We can think of this as understanding things in relation to each other. Finally, the cartographer can use their map to navigate to a destination. This is, essentially, creating a chain of steps across the map to get from one place to another.
Security analysis likewise follows a consistent workflow that occurs in both manual and automated approaches. First the attacker or defender enumerates a target by obtaining a list of target components such as servers, applications, and devices. Then they seek to understand it by assessing the relationships and configurations of components. Finally, they create that chain of steps from one element to another, identifying vulnerabilities that can lead to exploits. The metaphor between cybersecurity analysis and cartography aligns beautifully.
To prove the usefulness of this pattern, Table 1 provides examples for different types of security analysis:
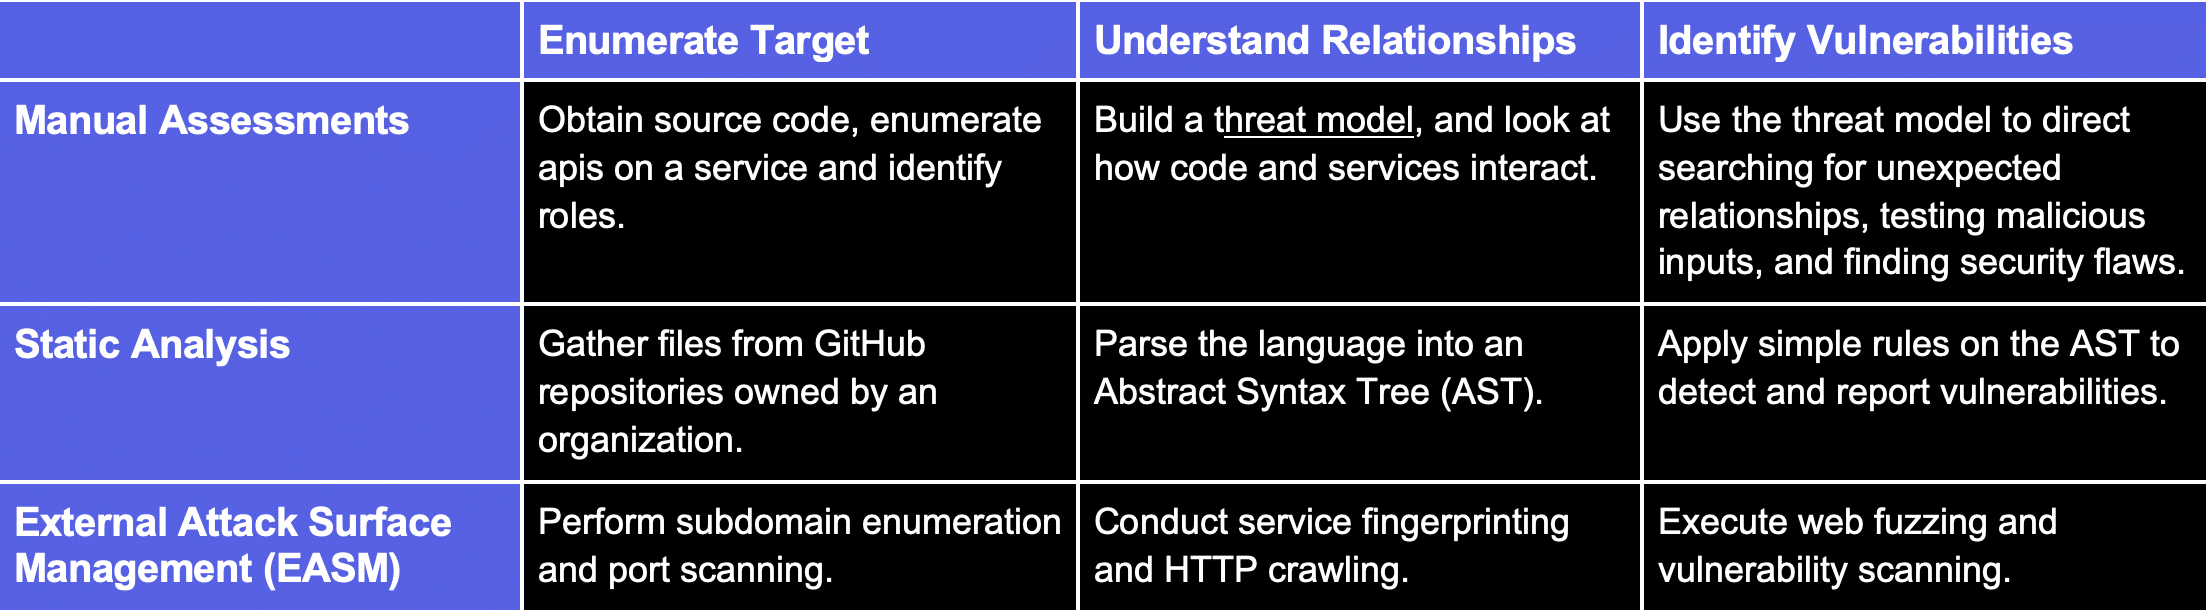
Table 1: Demonstrates how four types of security analysis align with the three step cartography process.
So what’s missing?
Many cybersecurity practitioners make an assumption that vulnerability identification is the only step from which results matter. After all, tooling often will perform the enumeration and understanding steps silently, and only report vulnerabilities. Tools build useful maps, then utilize them, but for some reason they never expose the maps directly. (Some reason = displaying good maps is a UX challenge, while displaying vulnerabilities is easy. We will discuss this later.)
The “map” itself is useful, however. Automated analysis cannot catch everything, but we can learn a lot from the information from enumeration and understanding steps. A tool that builds the map and makes it available to red and blue teams can further assist humans working to identify subtler vulnerabilities and inform architectural, system, and process decisions.
For example, Praetorian will share threat models during engagements. These are much like maps, being summaries of enumeration and understanding steps. They help our clients get a picture of their environments, understand where risks are, and make informed security decisions.
Open Source Tools
Many available tools effectively execute all three steps; however, they often fail to present information beyond resulting vulnerabilities. Here is a short list of tools available for different analysis types, with an emphasis on the available mapping features.
Static Analysis
Semgrep parses a language into an AST and applies user-defined rules to identify vulnerabilities. However, it does not provide an interactive or queryable way to access the AST.
The best tools auditors currently use to explore and navigate codebases are the same IDEs developers use to write code. These are effective as maps, but lack some especially useful security context and high-level control flow visualization. For binary analysis, tools like Ghidra are popular and build highly useful maps.
EASM
Project Discovery tools each contribute a small part of the analysis, allowing hackers to extract information from tools, such as httpx and katana, that enumerate and understand attack surfaces. These do have arguments to facilitate metadata retrieval, but the tools are designed primarily to inform deeper analysis and scanning when integrated with other tools.
What these tools miss is a way for security engineers to explore metadata and results from each scanning step in a flexible and comprehensive way – in current workflows, at best, the analysis data gets saved to a series of text files.
Cloud
ScoutSuite retrieves vast amounts of resource data and applies rules to identify vulnerabilities. Its enumeration step is limited, as cloud providers regularly introduce new asset types. Its understanding step also is restricted, as it does not fully recognize relationships between cloud assets, leading to false positives or noisy results.
Cartography enumerates and builds a map of cloud environments, using a Neo4j database as its interface. Its enumeration step shares limitations with ScoutSuite, and it does not directly perform any security analysis.
An alternative to an open-source tool is using the cloud provider’s interface directly. These are often somewhat searchable, especially for auditors who know where to look, but typically have limitations that hinder a comprehensive understanding when resources are shared between cloud services and even providers.
Sidebar: Praetorian’s Tools
Praetorian is mindful of existing tools’ limitations and has been steadily developing and open-sourcing tools to address gaps. Three of our open-sourced tools help security analysts better understand an attack surface in the following ways:
FingerprintX: Perform service discovery on open ports
NTLMRelay: Identify commonly accessible NTLM authentication endpoints
Nosey Parker: Identify vulnerabilities in textual data
Also, we have an exciting new tool in development to better enumerate cloud environments. Expect more news on that in the future!
Mapping is a UX problem
Mapping is not solely a technical problem. Most available tools have the data; however, they often do not provide an interface to view the map. While they utilize the data to identify a list of vulnerabilities, they don’t offer access to the intermediate data for manual analysis. The issue lies in the user experience and the effective presentation of information. Providing a list of vulnerabilities is much easier than rendering a useful and searchable visualization.
By exploring results from the enumeration and understanding steps via search and visualization, security analysts can uncover new vulnerabilities and inform decisions. This approach empowers insightful manual analysis, ultimately leading to the detection and prevention of subtler security issues that might have been difficult or impossible to identify in a fully automated way.
At Praetorian, in a step toward solving this UX challenge, we have released an enhanced asset view in Chariot. Information about open ports, running services, api responses, and metadata will be readily available to guide our security analysts’ next steps.
With so much valuable data available in the understanding step of scanning an attack surface, we can’t display it all at once. We chose the obvious solution: search. Figures 1 through 3 provide some examples of the new feature in use.
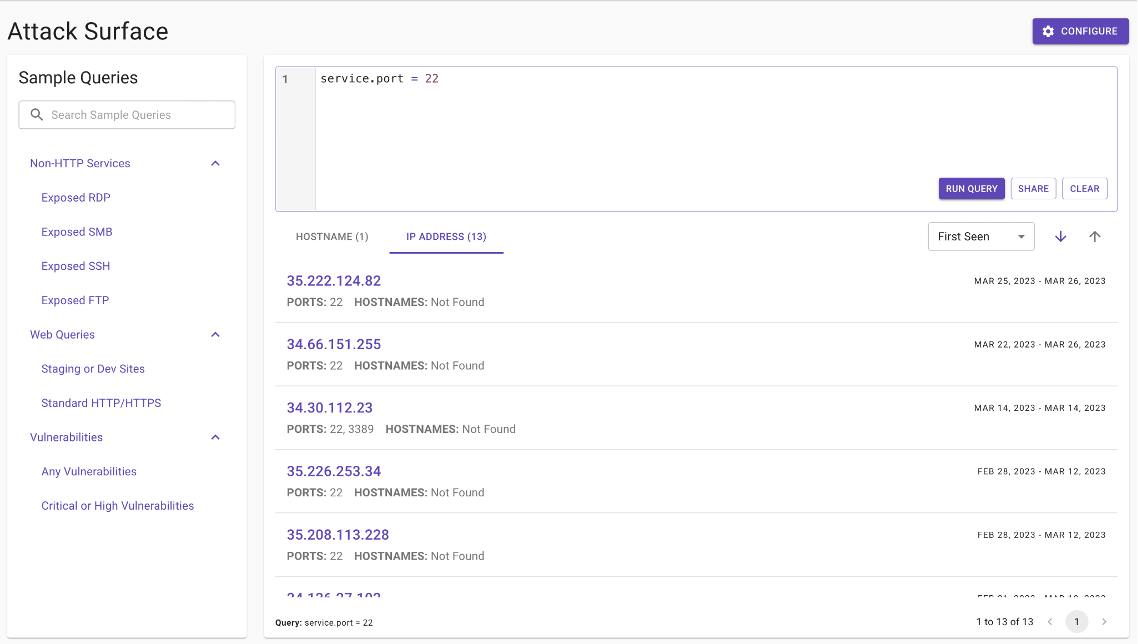
Figure 1: All ips with port 22 exposed.
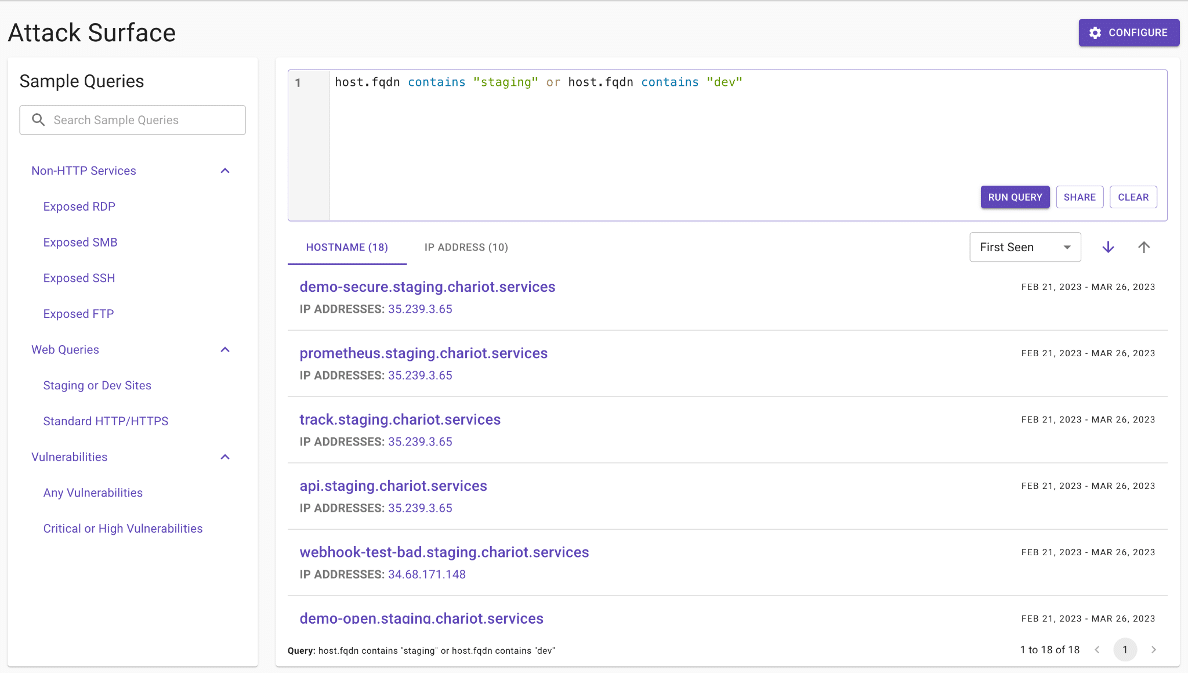
Figure 2: All hosts with ‘staging’ or ‘dev’ in their hostname.
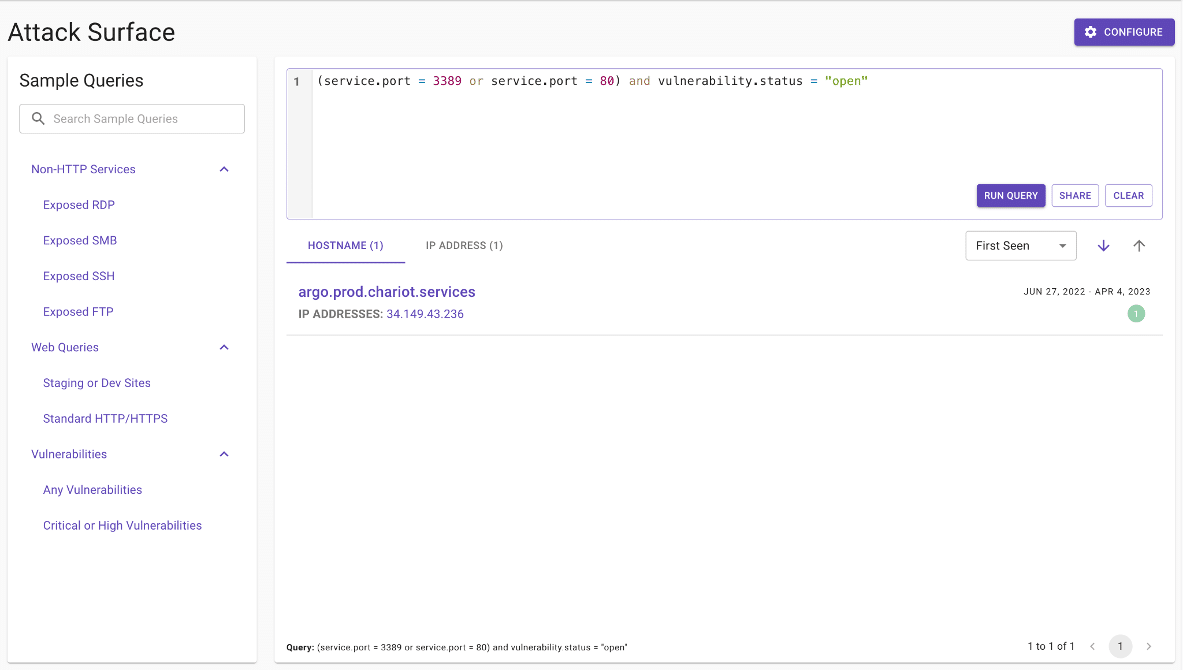
Figure 3: All hosts with rdp or http ports exposed, with at least 1 open vulnerability.
Cyber cartography can provide a wealth of information that adds value to manual testing, if tool developers are willing to make the data available to users in a visually useful way. We are incredibly proud of the team’s hard work on this feature, and we hope the security analysts using our platform find it invaluable.